D-Genies
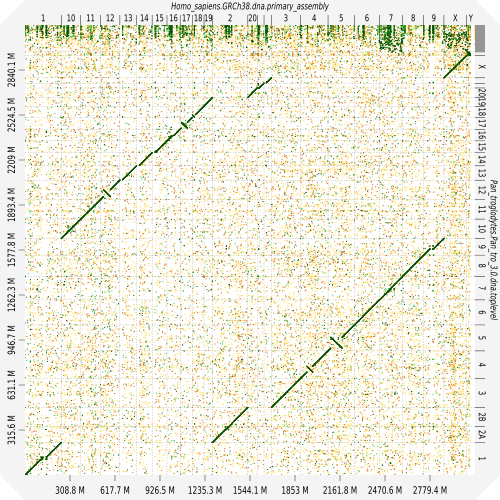
D-GENIES – for Dot plot large Genomes in an Interactive, Efficient and Simple way – is an online tool designed to compare two genomes. It supports large genome and you can interact with the dot plot to improve the visualisation.
We use minimap version 2 to align the two genomes. Then, the PAF file is parsed and plotted into an interactive plot written with d3.js library.
D-Genies also allows to display dot plots from other aligners by uploading their PAF or MAF alignment file.
D-Genies Summary
Dot plots are widely used to quickly compare sequence sets. They provide a synthetic similarity overview, highlighting repetitions, breaks and inversions. Different tools have been developed to easily generated genomic alignment dot plots, but they are often limited in the input sequence size. D-GENIES is a standalone and WEB application performing large genome alignments using minimap2 software package and generating interactive dot plots. It enables users to sort query sequences along the reference , zoom in the plot and download several image, alignment or sequence files. D-GENIES is an easy to install open source software package (GPL) developed in Python and JavaScript.
D-Genies Availability
D-Genies is available under the GNU General Public License (GPL). The package is coming with full documentation and test data. Sources are available here.